Wednesday, April 26th, 2017 and is filed under Construction, Economy, General, Housing Market, Housing Starts

MONTHLY DECLINES SHOULD NOT CREATE PANIC
March 2017 data released from the U.S. Department of Housing and Urban Development, the U.S. Commerce Department and the U.S. Census Bureau indicated that housing starts dropped in the national housing market. Specifically, the starts fell by 6.8% from February 2017 to a seasonally adjusted 1.22 million units.
Though the metrics dropped, the report suggested that “new housing production in the first quarter of this year is running 8.1% above the pace in 2016.1
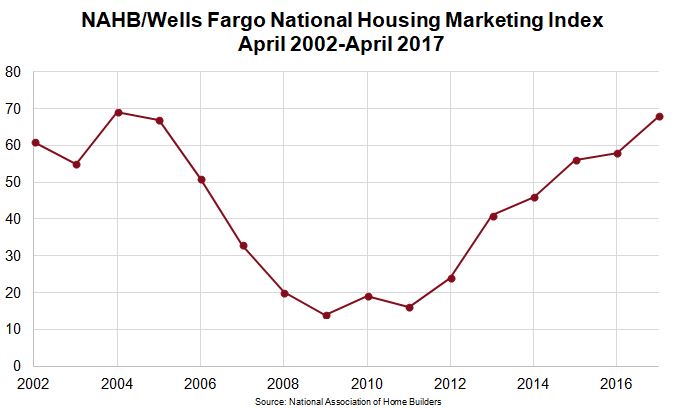
Furthermore, National Association of Home Builders (NAHB) chair Granger MacDonald also indicated that the numbers were aligned with the organization’s builder confidence metric, which also contracted slightly, but is “still on solid footing overall”2. Specifically, builder sentiment, which is calculated by both NAHB and Wells Fargo, fell 3 points to 68 in in April 2017.3 The March reading, incidentally, was at an 11-year high.
Still, is the decline an “oh no” moment? Does this mean we need to push the panic button, especially given that housing demand will likely continue strong through much of 2017?
Not really. While monthly metrics can be interesting to study, they rarely tell the whole story of a situation. It’s better to examine statistics over time to determine what is really going on.
National Housing Market Index and Builder Sentiment: The Long-Term View
Let’s start with the national Housing Market Index (HMI), which is based on a survey of NAHB members, that gauges the single-family housing market4. In the survey, respondents rate market conditions for the sale of new homes at the present time, and over the next six months, as well as ranking prospective buyers’ traffic as they view those new homes. The HMI ranges between 0-100, with 100 at the highest point. The graph below depicts the HMI over the past 15 years.

Though reports indicated that the index dropped month to month, it actually enjoyed a climb year over year since bottoming out at 14 in 2009, and for good reason. The Great Recession was nearing its end, but housing foreclosures were still high. No builder in his or her right mind would have qualified the situation as positive for sales of, or interest in, new houses. In 2009, it was all brokers and even builders could do to clear the huge backlog of inventory that was in existence.
Trends in Completed Housing
Exactly how high was that backlog?

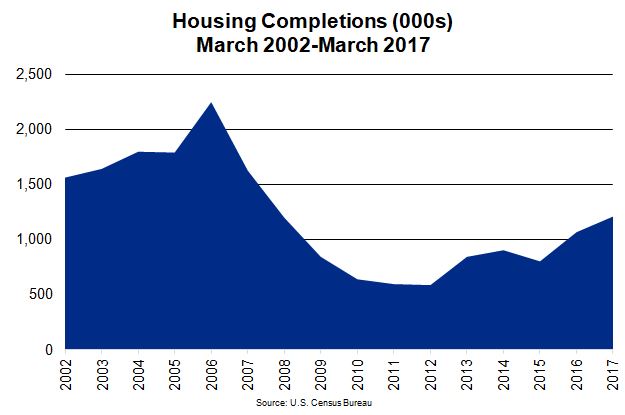
By the time March 2009 rolled around, approximately 1.2 million units of new housing had been completed and were delivered to the market. When we talk about “housing” we mean both for rent (apartments) and residential (owner homes and condominiums). This doesn’t count the fact that there was still backlog from 2006, which saw the completion of 2.2 million units, right about the time that the single-housing market was imploding.
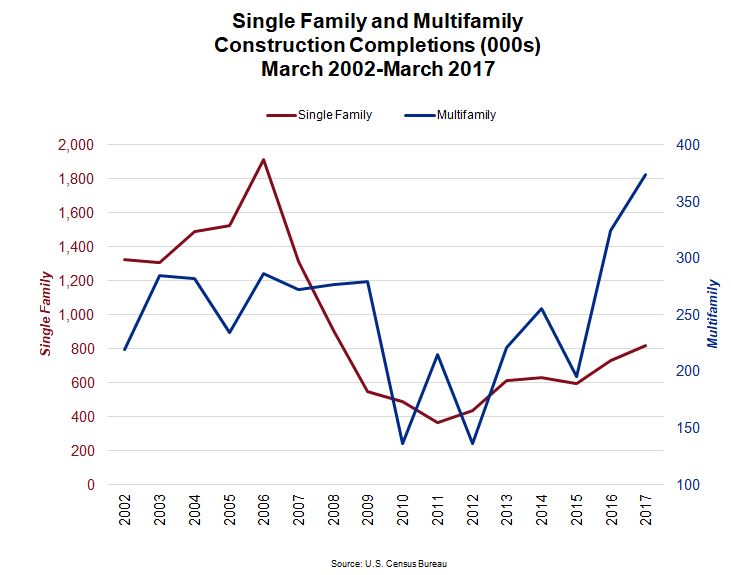
Breaking this down further in the graph below, we can see that in March 2006, single-family units made up the majority of housing that was delivered to the market. By 2009, the amount delivered had dropped by 64%. Again, brokers and home builders were trying to clear the backlog of what had been built a few years earlier. They were in competition with already existing homes that were flooding the market due to foreclosures.
Additionally, there weren’t many multifamily completions, either. Though there was plenty of demand for apartments, getting loans to build them was another matter.

What’s also interesting to note in the above graph is that multifamily completions expanded more quickly than single-family completions. We’ve written about this, as well. Namely, millennials and baby boomers have done a good job of spurring demand for apartments. That dynamic could change, however, given that more millennials are interested in buying homes, while much of the new multifamily product coming to market might not be affordable for many.
The Takeaway
The difficulty with examining any kind of numbers or metrics on a monthly basis is that such information is subject to volatility. For instance, the information presented noted that housing starts had dropped in March 2017. What it doesn’t say is why. The “why” could encompass anything from bad weather (Chicago and New York were both impacted by March blizzards), to labor or land shortages, to regulations. It doesn’t suddenly mean that builders are disenchanted with the housing market. It’s clear, from the builders’ sentiment survey, that they aren’t.
As such, it’s important to take anything that says “monthly,” followed by the words “decrease” or “increase” with grains of salt. While such statistics are interesting, taken by themselves, they might not mean a whole lot.